| |
|
|

Receive the monthly newsletter

www.laquestionclimatique.org
- CLIMATE -
What
is
Established with Scientific Certainty
and How
Measurements, physical laws, and observations
independent of numerical models and future projections
By the Scientific Committee "Terre & Climat"
(TM)
- France, 5 February 2026, revised 23 February 2026, v.1.7
| |
INTRODUCTION
Contemporary climate
debate often suffers from confusion between observed
facts, established physical laws, results derived from
numerical modeling, and future projections. Yet a
substantial part of climate science rests on direct
measurements and fundamental physical laws, independent
of any socio-economic scenario.
 This document presents
what is considered scientifically established, in
the strict sense of the term.
This document presents
what is considered scientifically established, in
the strict sense of the term.
1.
The Atmospheric Greenhouse Effect Is Demonstrated and
Measured
The outgoing infrared radiation from the Earth to
space, measured by satellites since the 1970s, is
currently about 238–239 W/m² of irradiance.
| |
|
Planck’s law describes the spectral radiance of
a black body, providing the complete and
continuous spectral distribution over all
wavelengths.
The Stefan–Boltzmann law (M =
εσT⁴)
is the integral of Planck’s law over all
wavelengths and allows temperature to be
inferred from the received irradiance M.
For atmospheric gases, which do not exhibit a
continuous spectrum, the Stefan–Boltzmann law is
not directly applicable. Their spectral
emissivity
ε(λ)
varies strongly with wavelength: some
wavelengths radiate very weakly (atmospheric
windows), while others behave as quasi-black
bodies (ε
≈ 1). Only an apparent
radiative temperature, dependent
on the measured spectral domain, can be defined
indirectly.
|
|
|
The
outgoing flux to space —
the only one that allows Earth to maintain thermal
equilibrium — corresponds to an equivalent radiative
temperature of approximately –18 °C (which is
still high compared with absolute zero). Its spectrum is
strongly shaped by the absorption bands of atmospheric
greenhouse gases (H₂O, CO₂, etc.) and no longer
corresponds to the continuous black-body spectrum
emitted by the Earth’s surface.
|
This is a measured fact,
not a theoretical construction.
By contrast, the measured
mean surface temperature is approximately +15
°C. This apparent difference of about 33°C necessarily implies an atmosphere
partially opaque to infrared radiation and
demonstrates the existence of a global
atmospheric greenhouse effect, resulting
from infrared absorption and re-emission by
atmospheric gases.
Spectral observations show
that the infrared radiation escaping to space
(apparent mean temperature ≈ –18 °C) originates
from a global equivalent mean altitude of
roughly 4–6 km,
rather than primarily from the surface. This
result, established by the work of
Goody and Yung (1952–1989) and subsequently
confirmed by modern satellite measurements,
constitutes a direct observational demonstration
of the atmospheric greenhouse effect.
The probability
coefficients defined by Einstein play a role in
complex radiative phenomena within the
atmosphere, notably the absorption and
spontaneous and induced emission of infrared
radiation by greenhouse gases. Spontaneous
emission (coefficient Aul) and induced emission (coefficient
Bul) coexist and are proportional to
the wavelength
ν³.
Aul
= (8πhν³/c³) × Bul,
where h is Planck's constant and c is
the speed of light.
At the principal wavelength of CO₂, isotropic
spontaneous emission is 27 times more intense
than induced emission.
|
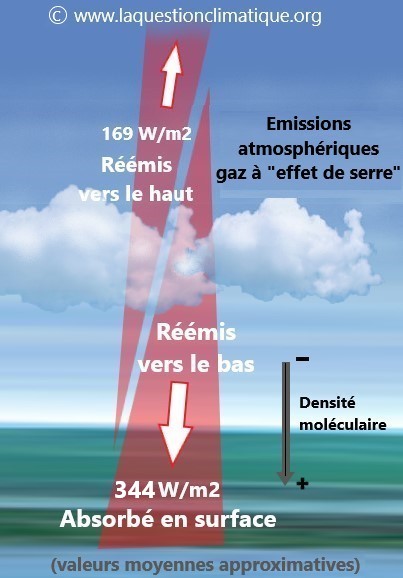 |
A simple illustration:
if a warm source (the Earth’s surface) is covered by even a thin curtain,
the source must become warmer in order to heat the
region above the curtain (toward space) to the same
extent.
2.
Global Mean Temperature Has Increased for More Than a
Century
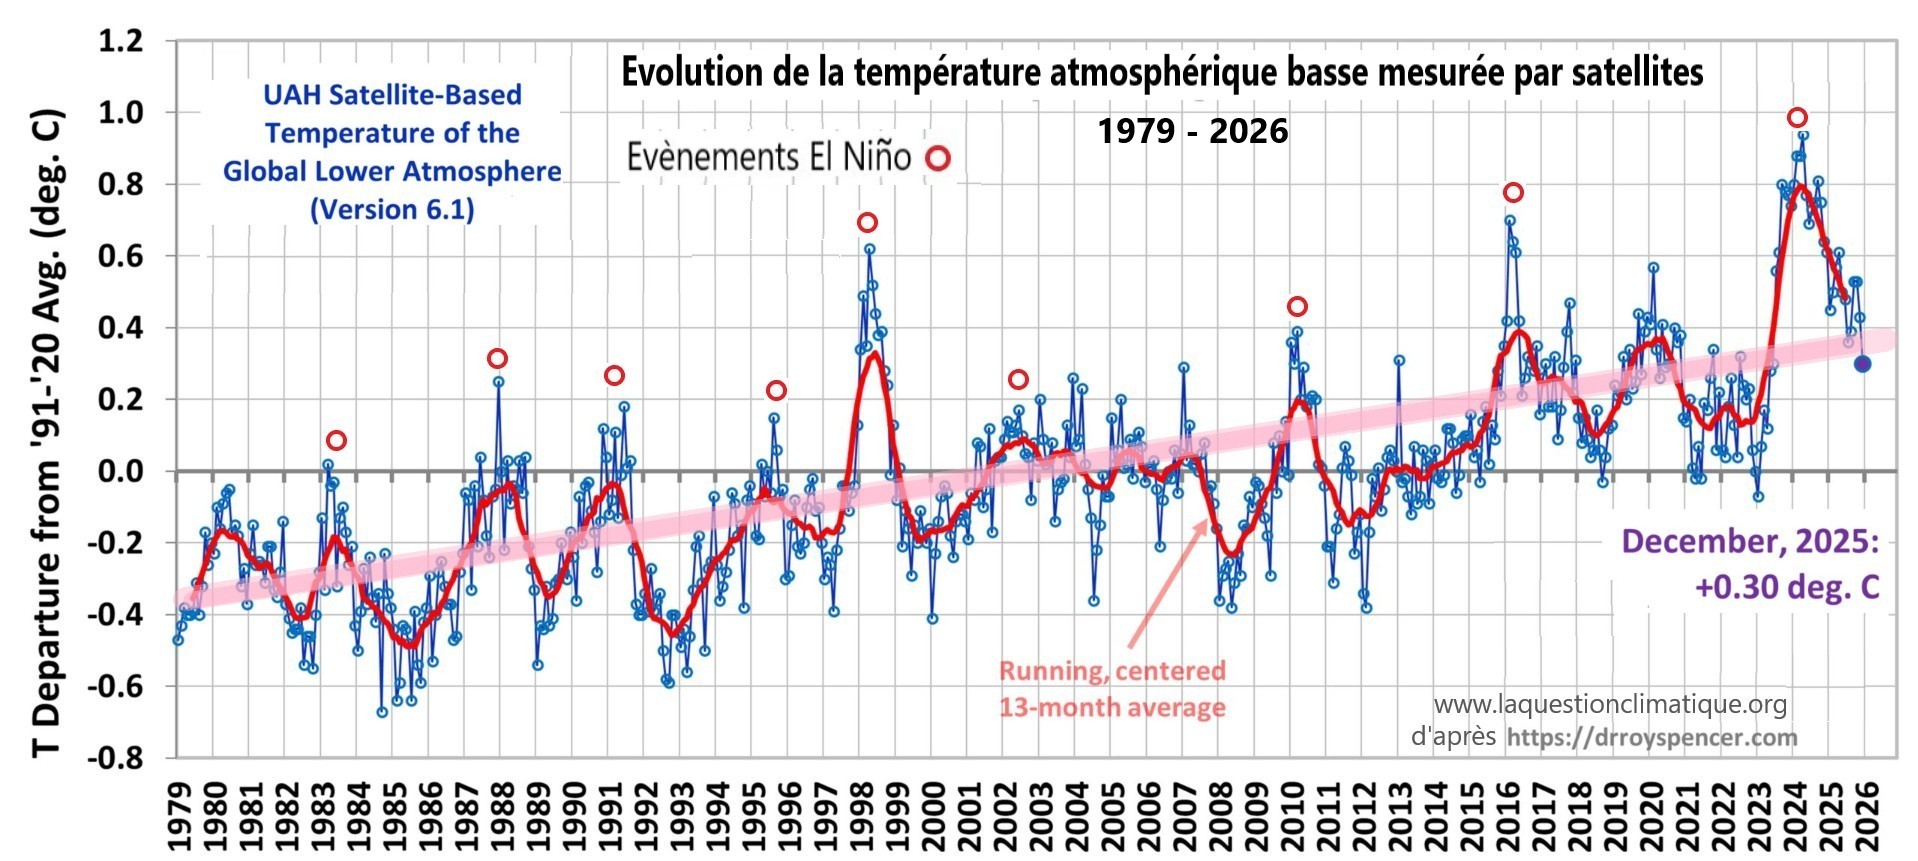
Temperature series from
independent datasets (land stations, ocean buoys,
satellites) show a clear increase in global mean
temperature since the late 19th century: approximately +1.2°C.
This trend is observed
outside periodic El Niño events and is confirmed by
multiple independent measurement methods.
IPCC AR6 reference :
WG1, Chapter 2
Global surface temperature evolution since 1880
(According to NASA/GISS)

Lower tropospheric temperature measured by
satellites
(According to UAH v6.1)
For 47 years
In France,
located in the Northern Hemisphere, which is warming
faster due to a smaller oceanic surface
area, Météo-France reports a warming of
approximately +2.2°C since the 19th century.
3.
Anthropogenic Increase in
Atmospheric CO₂
Continuous measurements since 1958 show an increase in
atmospheric CO₂ from about 315 ppm to more than 420
ppm (+33%). Isotopic analyses of carbon (¹²C, ¹³C, ¹⁴C)
indicate that this increase — partially limited by
oceanic and biospheric uptake — originates primarily
from fossil-fuel combustion and deforestation.
This attribution is robustly established.
Relative to earlier
pre-industrial levels (~280 ppm), the increase amounts
to approximately +50%.
|
Methane and nitrous oxide
concentrations, of lesser importance for the
total
greenhouse effect, have also increased
significantly since the pre-industrial era,
and
their anthropogenic origin is well documented.
|
|
4. Variations in Solar
Irradiance Are Small Over the Recent Period
The Baseline Surface Radiation Network (NASA-BSRN)
provides quasi-continuous,
long-term, in-situ measurements of broadband surface
irradiance (solar and thermal infrared radiation), along
with associated parameters, through a global network of
more than 70 sites.
Satellite measurements of Total
Solar Irradiance (TSI) since 1978 show solar cycles
(notably the well-known ~11-year cycle) with no
increasing trend over recent decades (TSI ≈ 1361
W/m²).
The IPCC AR6 :
WG1,
Chapitre 2
(Changes in Climate System Drivers - Solar and Orbital
Forcing)
concludes that the recent solar contribution to
radiative forcing is very small compared with that of
greenhouse gases, with no recent upward trend.
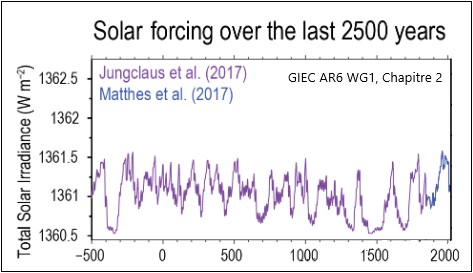
Several recent studies
even indicate a slight weakening of solar irradiance
over recent decades.
| |
Other thermal influences
—
negligible energies %
relative to the Sun
Geothermal energy (including volcanism) 0,04 %
Human activities (industry, combustion, etc.)
0,02 %
Tidal energy
0,003 %
Heat flux from Earth’s core
0,04 % |
|
5.
Atmospheric Infrared Back Radiation Is Measured
SURFACE ENERGY
BALANCE
W/m2
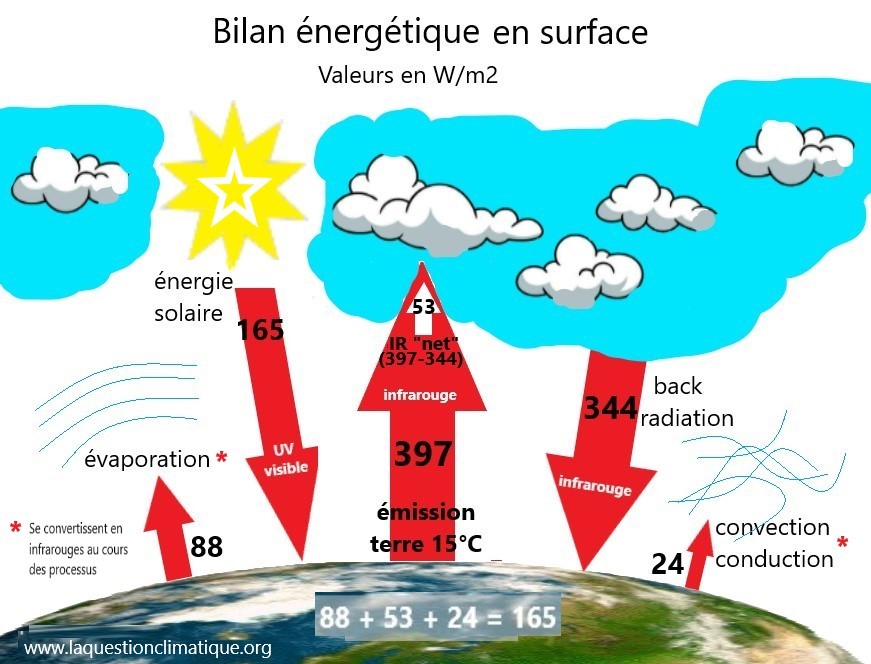
Downwelling
longwave radiation (DLR), often referred to as infrared
atmospheric back radiation, has been directly measured for several decades
using calibrated pyrgeometers. Observations from
the Baseline Surface Radiation Network Baseline Surface
Radiation Network (BSRN)
show a global mean irradiance on the order
of 340–345 W/m² -
(344 ± 3 W/m² according to a recent synthesis article).
This irradiance varies
strongly with latitude; values of about 70 W/m² are
observed near the poles.
In FRANCE, downwelling longwave irradiance is measured at SIRTA (Palaiseau).
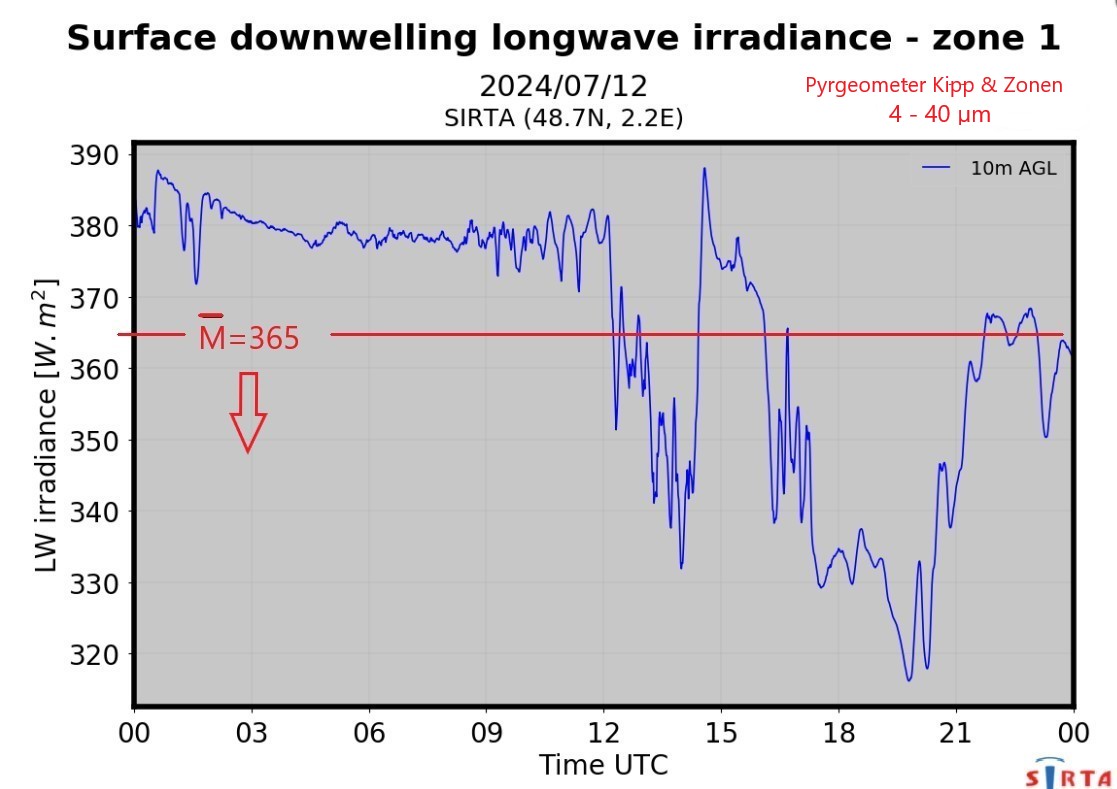
These measurements are
purely observational: they do not depend on climate
models or on any disputable theoretical assumption.
Due to back radiation, the Earth's surface, heated
to 15°C and which, according to the Stefan-Boltzmann
law, should radiate approximately 297 W/m² depending on
its temperature, has a "net" radiation (cooling the
surface) of only about 53 W/m² (= 397 - 344). This is
generally poorly understood.
IPCC AR6 reference :
WG1, Chapitre 7 (Radiative
Forcing).
|
It
is nevertheless important to note that the
Earth’s surface warms through global energy
re-equilibration following changes induced
by radiative forcings, rather than through
the direct reception at the surface of
individual forcings considered in isolation.
|
6.
Clouds Emit Infrared Radiation Toward the Surface
Clouds, composed of liquid water droplets or ice
crystals at temperatures far above absolute zero, emit
infrared radiation in accordance with
Planck's
law,
according to their
spectral properties, both upward and downward. This
emission is spectrally measured and routinely observed
(including the well-known phenomenon of warmer cloudy
nights).
Low-level clouds (stratus, stratocumulus) can increase
downwelling longwave radiation by 50 to 100 W/m².
The IPCC states that the infrared effect of clouds is
well established, even though their net global radiative
balance — due to their high variability and their impact
on albedo — remains a major source of uncertainty.
IPCC AR6 reference : WG1, Chapitre 7
7.
Spectral Line Broadening:
Undisputed Physics
Atmospheric gases, particularly CO₂, absorb infrared
radiation in specific spectral lines that broaden and
strengthen (line wings) through
fundamental physical mechanisms :
pressure broadening,
molecular collisions, Doppler effects, and quantum
resonance phenomena (notably Fermi resonance for CO₂).
This explains why increases in atmospheric CO₂ continue
to have a measurable effect, although increasingly
attenuated, even though the main absorption band near 15 µm
is already close to
saturation.
CO₂ cannot become globally “saturated,” because the
effect of increasing concentration follows a logarithmic
law :
ln(CO2_n/CO2_0)
and therefore never becomes zero. Moreover, as
CO₂ concentration increases, the effective altitude of
infrared re-emission shifts upward to colder layers,
requiring a slight warming to re-establish radiative
balance with space.
These mechanisms are measured in laboratory experiments
and incorporated into reference spectroscopic databases
such as
HITRAN.
IPCC AR6 reference:
WG1, Chapter 6, pp. 853–854 (Radiative processes)
8. Sea level
Coastal tide gauges
indicate a rise in global mean sea level of
approximately 18–22 cm since 1900, corresponding to an
average rate of 1.2–1.7 mm/year during the 20th century,
corrected for vertical land motion (isostatic
adjustment).
| |
At Brest (France), where tide gauges have recorded
sea level for three centuries — a unique dataset
worldwide — observations show an increase of
about 30 cm over the past 300 years. |
|
Since the beginning of satellite altimetry in 1993,
measurements show a mean rise of approximately 3.2–3.5
mm/year, with a recent acceleration reaching 3.5–4.0
mm/year(TOPEX/Poseidon,
Jason-1/2/3).
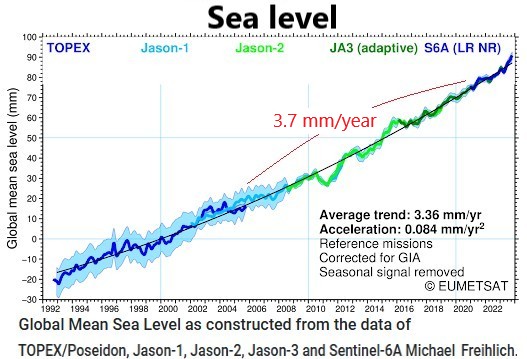
This rise results
primarily from thermal expansion of seawater and melting
of continental ice. It is a directly measured
phenomenon, independent of climate models.
These contributions are observed using satellite
gravimetry (GRACE / GRACE-FO),
altimetry, and ocean measurements (ARGO).
9. IPCC Temperature Projections Are High and
Imprecise
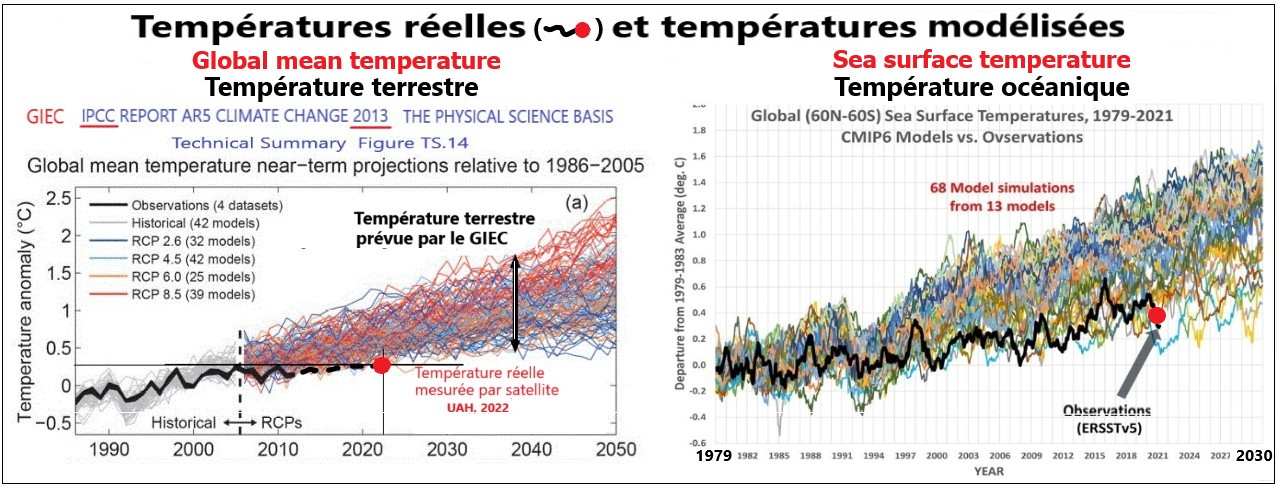
The temperature projections published by the IPCC
are primarily based on numerical climate models used to
explore a range of possible future greenhouse gas
emission scenarios.
These projections do not constitute deterministic
forecasts, but rather conditional simulations, dependent
both on the socio-economic assumptions adopted and on
internal model parameters, some of which—particularly
climate sensitivity and cloud feedbacks—remain
imperfectly constrained by observations.
As such, the range of projected warming should be
interpreted with caution. The discrepancies observed
between simulated trajectories and the temperature
evolution actually observed over recent decades indicate
that climate models tend to produce a wide dispersion of
outcomes, including high-warming scenarios whose
real-world probability remains a matter of scientific
debate.
These projections therefore serve as tools for exploring
potential climate risks, rather than as quantitatively
certain descriptions of the future evolution of the
climate system.
Global mean temperature (IPCC page n°87)
Sea Surface Temperature (Dr Roy Spencer)
CONCLUSION
The phenomena presented in
this document are based on direct instrumental
observations and fundamental physical laws. They
constitute a robust scientific foundation, independent
of numerical models, assumptions, or prospective
scenarios.
Current scientific debates concern complex
feedbacks and the future magnitude of warming, not these
established foundations.
| |
UNCERTAINTIES
What Climate Science
Cannot Yet Assert
Climate science today
rests on a robust foundation of observed facts
and established physical laws. Nevertheless,
despite abundant observations and solid
underlying physics, several central questions
remain open. Significant uncertainties persist
regarding feedbacks, regional scales, and the
precise future evolution of the climate system.
It is essential to distinguish these
uncertainties clearly from established facts.
Acknowledging these limits
does not weaken science; on the contrary, it is
a fundamental methodological requirement.
A. The Precise Long-Term
Value of Climate Sensitivity
λ to CO₂
Climate sensitivity (the
global temperature increase associated with a
doubling of CO₂) is not directly measured.
Estimates rely on paleoclimate reconstructions,
recent observations, and climate models. Despite
decades of research, the uncertainty range
remains wide. IPCC AR6 explicitly acknowledges
that this value is not precisely known and
remains one of the most influential and
uncertain parameters in future projections
(additional warming beyond the minimal,
incompressible spectroscopic Planck forcing).
B. The Exact Role of Cloud
Feedbacks
Clouds influence both
reflected solar radiation (cooling effect) and
infrared radiation emitted toward the surface
(warming effect). While their downwelling
infrared effect is measured, their net global
feedback (positive or negative) remains poorly
constrained. Differences in cloud representation
account for a significant fraction of the spread
among climate model results.
C. The Amplitude of
Internal Natural Variability on Decadal Scales
Oceanic and atmospheric
systems exhibit natural oscillations (ENSO, PDO,
AMO, etc.) whose true amplitude, duration, and
interaction with long-term trends are not fully
quantified. It is therefore not possible to
precisely attribute, year by year or decade by
decade, the respective contributions of external
forcings and internal variability.
D. Direct Transposition of
Global Trends to Regional Scales
Trends observed at the
global scale do not translate mechanically to
regional or local scales. Regional projections
depend strongly on models, show marked
divergences, and involve uncertainties greater
than those of global means.
E. The Exact Future
Evolution of the Climate System
Climate projections depend
on emission scenarios, socio-economic
assumptions, and internal model parameters. They
are not predictions in the strict sense, but
conditional explorations of possible futures.
Science
therefore cannot assert a single, certain
climate trajectory.
|
|
|
|

An other article : Climatic
Sensibility and CO2
Join
us

Via nos amis de Terre & Climat
la.question.climatique@orange.fr
Copyright Terre & Climat (TM) and www.laquestionclimatique.org 2026, all
rights reserved
|